What is Kubernetes monitoring?
Kubernetes monitoring involves collecting, analyzing, and acting on performance data and metrics across your clusters. This encompasses everything from individual pods to entire cluster nodes, providing insights into the health and efficiency of your applications and infrastructure. Monitoring Kubernetes is crucial for diagnosing issues, optimizing resource utilization, and ensuring your applications run smoothly in a production environment.
This blog post will explore Kubernetes monitoring, the key metrics to track, how to choose the correct monitoring tools, and best practices for ensuring your Kubernetes environment is efficient, reliable, and secure.
Kubernetes Security For Dummies
Implement and run secure container-based applications a whole lot easier.
Download now
How Kubernetes monitoring differs from traditional monitoring
Traditional monitoring approaches often focus on individual servers or VMs, but Kubernetes monitoring requires a different mindset. K8s environments are dynamic, with containers constantly being created and destroyed. Monitoring at various levels, including the container, pod, and cluster levels, is necessary to get a comprehensive view of your entire ecosystem.
Additionally, Kubernetes monitoring emphasizes resource metrics such as CPU and memory utilization, disk utilization, and network usage, all of which are critical for managing containerized applications.
Kubernetes Security Best Practices [Cheat Sheet]
This 6 page cheat sheet goes beyond the basics and covers security best practices for Kubernetes pods, components, and network security.
Download Cheat Sheet

Key metrics to track in Kubernetes monitoring
Monitoring various metrics that provide insights into the performance and status of your containerized applications and infrastructure is essential to ensure the health and efficiency of your Kubernetes clusters. Here, we break down the critical Kubernetes metrics into three main categories: performance, health, and resource utilization.
Performance metrics
Pod performance: Monitoring pod performance is critical for understanding how individual applications run within your clusters. Key metrics here include pod startup time, restarts, and the rate of pod failures, which can indicate issues with application stability or deployment configurations.
Node performance: Nodes are the workhorses of your Kubernetes cluster, and their performance directly impacts the efficiency of your apps. Important node performance metrics include node availability, CPU and memory usage, and network IO; these help identify bottlenecks or resource constraints at the cluster node level.
Health metrics
System health: System health metrics provide a high-level overview of the K8s cluster's health, including the status of critical components like the scheduler, controller manager, and etcd. Monitoring these components ensures that the Kubernetes control plane is functioning correctly.
Application health: These metrics focus on the operational status of your deployed applications, including service response times, error rates, and transaction volumes. Such metrics make sure your applications meet their performance and availability objectives.
Resource utilization metrics
CPU and memory utilization: Tracking CPU and memory is fundamental to managing container resources effectively. Knowing your CPU usage, memory consumption, and memory leaks at both the pod and node level helps optimize application performance and avoid resource contention.
Storage and network usage: Disk utilization metrics, including read/write operations and storage capacity, are critical for managing persistent data in Kubernetes. Network usage metrics, such as bandwidth usage, packet loss, and latency, ensure that your applications can communicate efficiently within the cluster and with external services.
In the next section, we'll explore how to pick the Kubernetes monitoring solution that best meets your specific needs and objectives.
Kubernetes Vulnerability Scanning
Kubernetes vulnerability scanning is the systematic process of inspecting a Kubernetes cluster (including its container images and configurations) to detect security misconfigurations or vulnerabilities that could compromise the security posture of the cluster.
Read more
Choosing the right Kubernetes monitoring tool
This is pivotal for the continuous health and performance of your Kubernetes clusters. The right solution not only provides real-time insights into your containerized applications but also integrates seamlessly with your Kubernetes environment. Here are the criteria to consider when choosing.
Real-time monitoring capabilities
In a fast-paced Kubernetes environment, real-time monitoring is crucial for quickly uncovering and remediating issues. The chosen tool should offer real-time data collection and alerting capabilities to help you address problems before they impact your applications or users.
Customization and scalability
Every Kubernetes deployment is unique, and your monitoring tool should be flexible enough to adapt to your specific needs. Look for tools that offer customizable dashboards and metrics, allowing you to focus on the data that matters most to your organization.
Additionally, the tool should scale seamlessly with your Kubernetes clusters, ensuring consistent performance as your environment grows.
Integration with other tools and systems
Kubernetes is often just one part of a larger technology stack. Your monitoring tool should integrate well with other cloud services, incident management platforms, continuous integration/continuous deployment (CI/CD) pipelines, and the like. This ensures a cohesive monitoring strategy that provides visibility across your entire infrastructure.
CI/CD Pipeline Security Best Practices
Continuous integration and continuous delivery (CI/CD) have become the backbone of modern software development, enabling rapid, reliable, and consistent delivery of software products. To bolster your CI/CD pipeline, ensuring resilience against ever-evolving threats, follow the best practices in this guide.
Read more

Popular Kubernetes monitoring tools
Several tools in the market excel in monitoring Kubernetes environments. Below we briefly discuss some popular options.
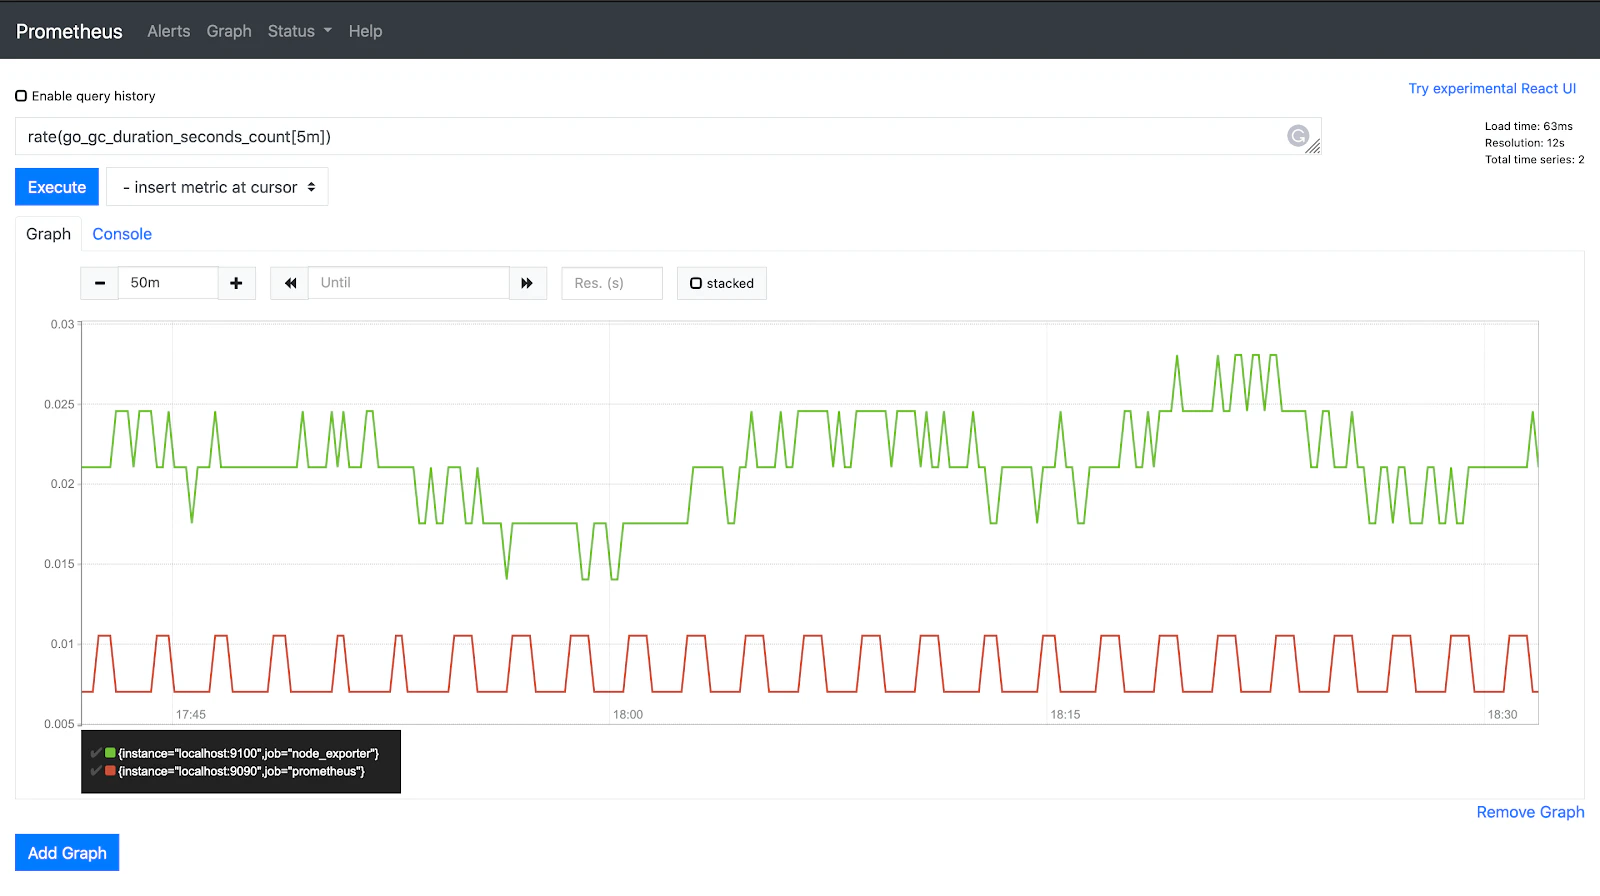
Prometheus
Recognized as the de facto open-source monitoring solution for Kubernetes, Prometheus excels with its powerful query language (PromQL) and robust alerting features. Its multidimensional data model and scalability make it an ideal tool for K8s monitoring.
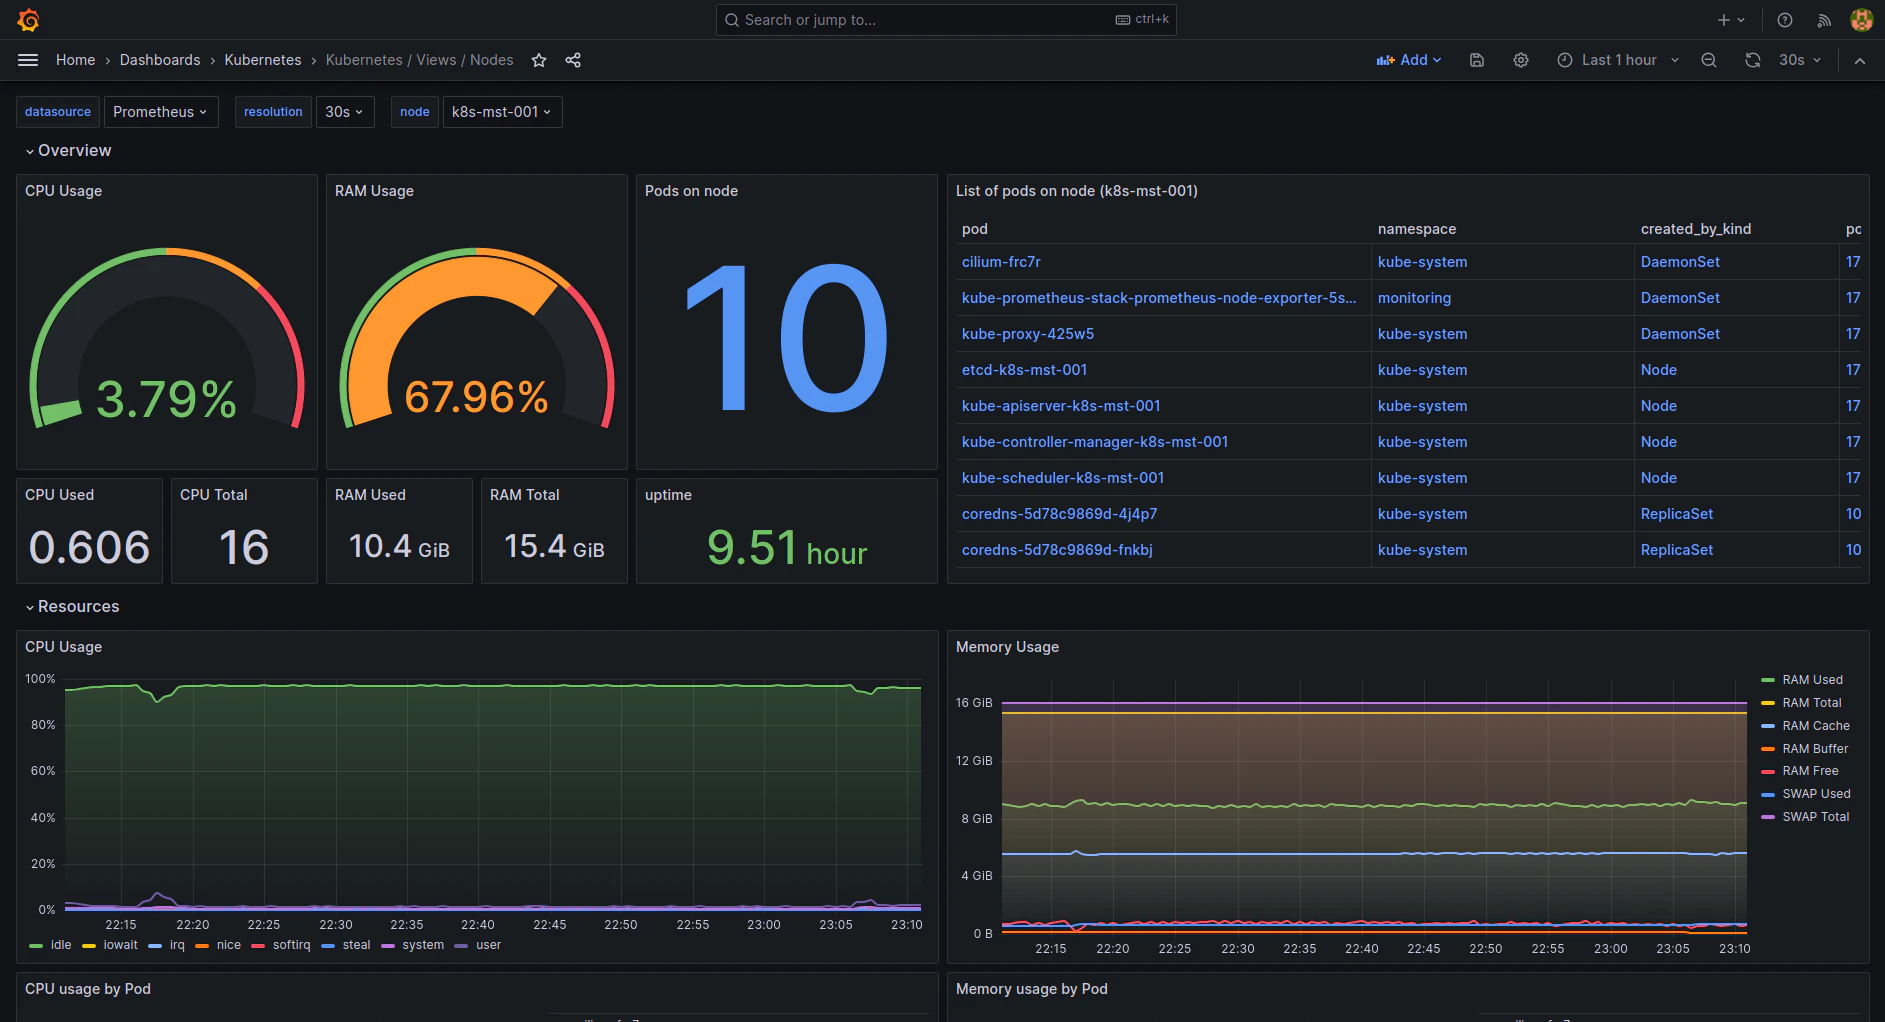
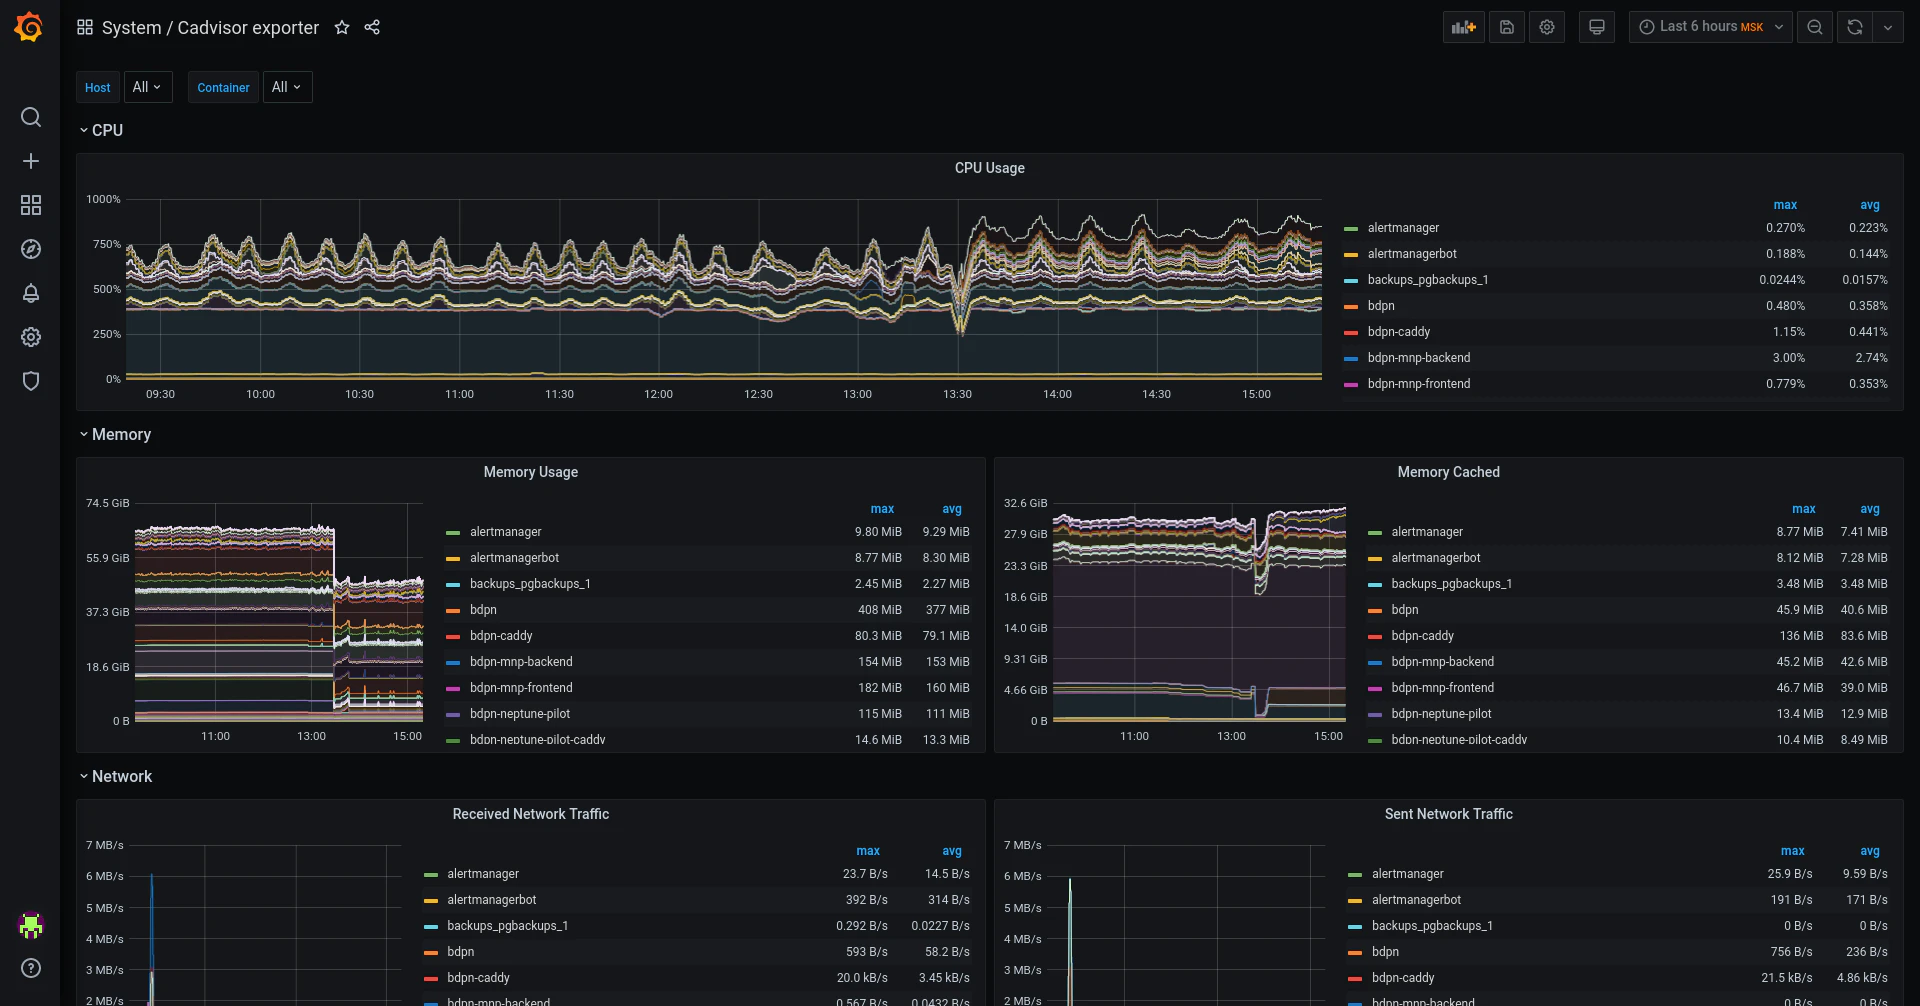
Grafana
While primarily a visualization tool, Grafana is often used alongside Prometheus to provide advanced data visualization capabilities. Its customizable dashboards are popular within the Kubernetes community for their ability to display complex metrics in an easy-to-understand format.
Elastic Stack
Comprising Elasticsearch, Logstash, and Kibana, the Elastic (or ELK) Stack offers powerful logging and monitoring capabilities. It's particularly effective for analyzing large volumes of log data and integrates well with Kubernetes for log aggregation and analysis.
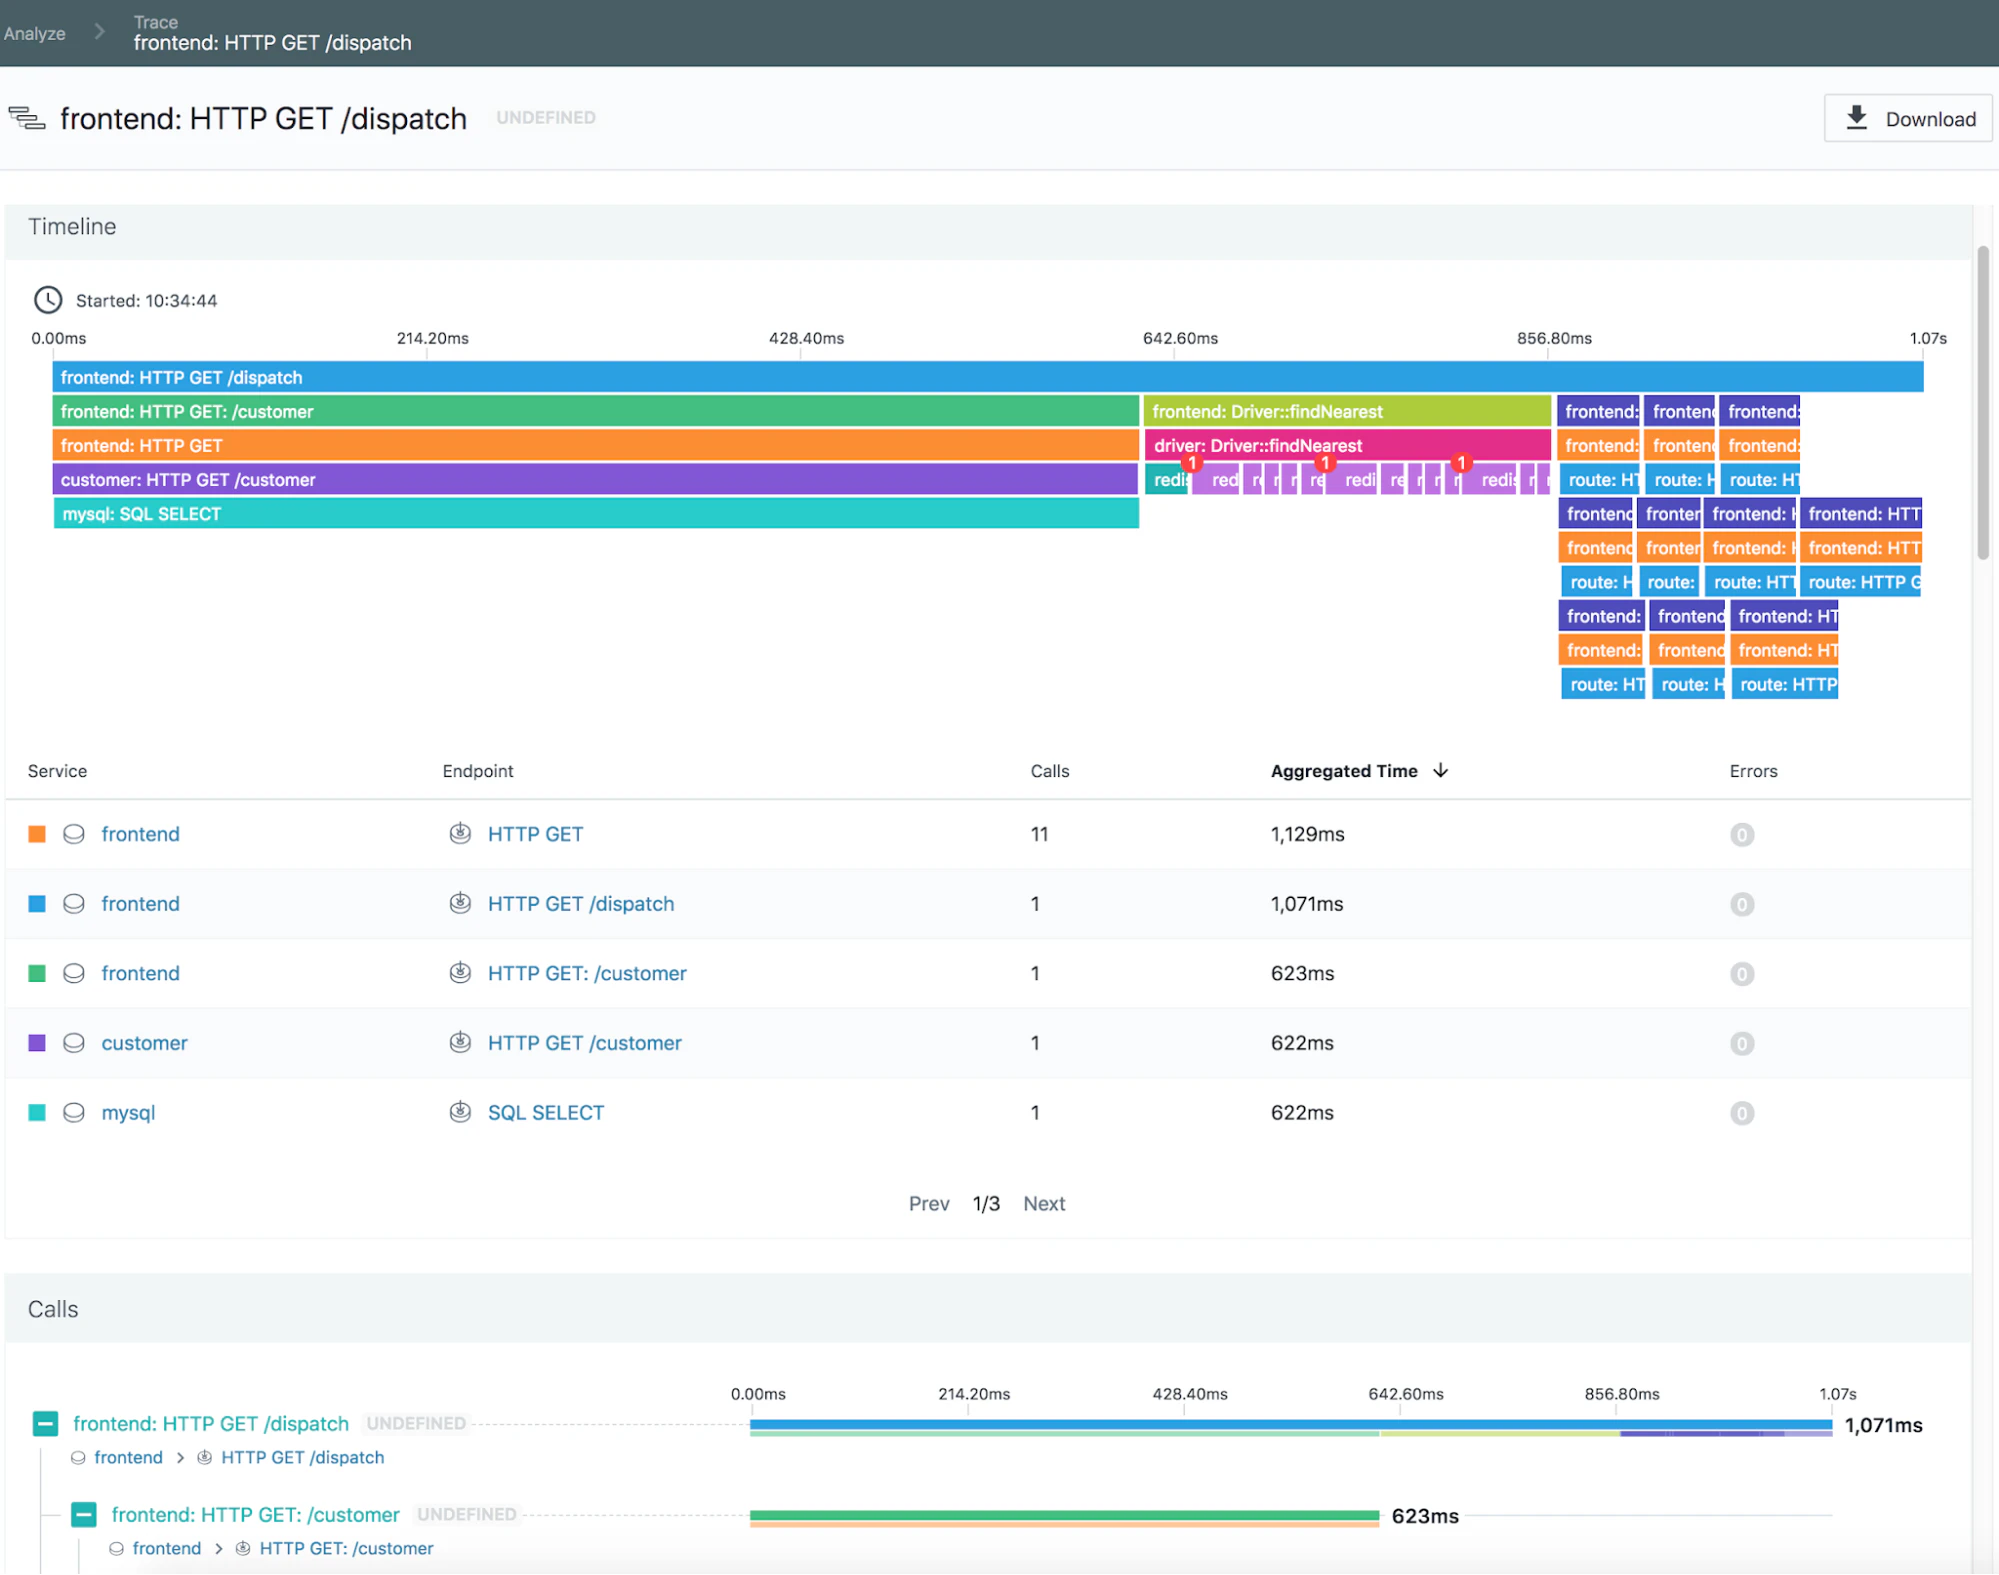
Jaeger
Tailored to monitor microservices and distributed systems, Jaeger specializes in tracing and providing insights into software performance and latency issues. Its seamless integration with Kubernetes offers visibility into complex service interactions.
cAdvisor (Container Advisor)
Developed by Google, cAdvisor offers container-specific metrics about resource usage and performance. Integrated into the kubelet, it provides a native solution for monitoring resource utilization in Kubernetes environments.
In the next section, we'll explore the best practices for Kubernetes monitoring; these are crucial for maintaining a robust and efficient Kubernetes environment.
Best practices for Kubernetes monitoring
Set up effective alerts and notifications
Define critical metrics: Identify the most vital metrics to your application's performance and reliability. For Kubernetes, these include CPU and memory usage thresholds, pod crash loops, and high error rates in your applications.
Use Prometheus Alertmanager: If you're using Prometheus for monitoring, configure Alertmanager to handle alerts based on your defined metrics. You can set it up to group and route alerts to your preferred notification channels, such as email or Slack.
Example alert for memory usage via Alertmanager:
groups:
- name: example
  rules:
  - alert: HighMemoryUsage
    expr: (node_memory_Active_bytes / node_memory_MemTotal_bytes) > 0.8
    for: 5m
    labels:
        severity: page
    annotations:
        summary: High Memory Usage on {{ $labels.instance }}
        description: "{{ $labels.instance }} has had high memory usage for more than 5 minutes."
Test your alerts: Regularly test your alerting paths to be certain they’re functioning as expected. You can simulate conditions that trigger alerts in a controlled environment to verify notifications are being sent correctly.
Ensure high availability and disaster recovery in monitoring setups
Deploy monitoring tools in high availability mode: For critical monitoring components like Prometheus, run multiple instances in different availability zones or clusters to ensure redundancy. Also, leverage a load balancer to distribute traffic between instances.
Example Prometheus configuration for multiple scrape resources:
global:
  scrape_interval:     15s
  evaluation_interval: 15s
  external_labels:
      monitor: 'codelab-monitor'
scrape_configs:
  - job_name: 'prometheus'
    static_configs:
      - targets: ['localhost:9090', 'other-instance:9090']
Back up configuration and data regularly: Automate the backup of your monitoring configuration and data. For Prometheus, this might involve snapshotting the Prometheus data directory and storing it in a secure, offsite location.
Create strategies for optimizing resource utilization and cost efficiency
Monitor resource utilization: Use cAdvisor or Prometheus to monitor resource utilization metrics like CPU and memory usage. Set up alerts for when usage approaches your defined thresholds.
Implement resource limits: Based on your monitoring data, define and enforce resource limits and requests in your Kubernetes pod specifications. This will prevent any single application from consuming excessive resources.
Example pod definition with resource limits and requests:
apiVersion: v1
kind: Pod
metadata:
  name: myapp-pod
spec:
  containers:
  - name: myapp-container
    image: myapp:latest
    resources:
      limits:
        memory: "512Mi"
        cpu: "1"
      requests:
        memory: "256Mi"
        cpu: "0.5"
By following these best practices and implementing the actionable steps provided, you can establish a robust Kubernetes monitoring strategy that enhances your containerized apps' performance, reliability, and cost-efficiency.
Kubernetes Vulnerability Scanning
Kubernetes vulnerability scanning is the systematic process of inspecting a Kubernetes cluster (including its container images and configurations) to detect security misconfigurations or vulnerabilities that could compromise the security posture of the cluster.
Read moreConclusion
Proper monitoring is not just “nice to have.” It’s critical to the successful management and scaling of containerized applications in Kubernetes environments.
Effective Kubernetes monitoring empowers you to uncover and remediate issues proactively, allowing for optimized resource use and ensuring that applications meet performance and reliability standards.
By implementing the strategies and tools discussed, you can achieve a deeper understanding of your Kubernetes environment, leading to more informed decision-making and improved operational efficiency.
How Wiz can help
If you’re looking to boost your Kubernetes monitoring capabilities, Wiz offers a unified cloud security platform with prevention, detection, and response capabilities. It enables security, development, and DevOps teams to collaborate effectively in a cloud-native environment with features like:
Container & Kubernetes security: Secure your containerized apps and K8s environments from build-time to runtime, addressing security risks holistically.
Comprehensive cloud security: From vulnerability management to compliance assurance, Wiz provides a single pane of glass for all your cloud security needs, integrating seamlessly with your cloud environments.
Real-time threat detection: Monitor your cloud workloads for suspicious activity and gain actionable insights to respond to threats proactively.
Wiz not only supports Kubernetes monitoring but also enhances your overall cloud security posture via deep visibility, accurate prioritization, and business agility.
Embrace the future of cloud security and monitoring with Wiz, and ensure your cloud environments are not just monitored but thoroughly secured.
To discover how Wiz can transform your Kubernetes monitoring and security strategy, consider scheduling a demo today.
Learn why the fastest growing companies choose Wiz to secure containers, Kubernetes, and cloud environments from build-time to real-time.